Projects, designs, and writings on health IT

2018-04-11

Optimizing level of service for billing in the inpatient and outpatient worlds

12:56 PM Posted by David, MD No comments
Billing rules for inpatient and outpatient providers are complicated, and as a result, providers' small habitual practices can have major financial implications. Accurate billing depends on accurate documentation of HPI, family history, social history, among others. Some of these can be enforced using templates, but when it comes to the assessment and plan, much of the importance is in the wording of documentation (especially in hospital billing) and the assessment of the complexity (especially in profession billing). Here, I describe some of my investigations in this area.

Inpatient Hospital Billing (DRGs)

Provider documentation helps classify patients into a DRG (Diagnosis-related group) and various risk-stratifying scores. The DRGs a patient falls into, and whether or not there is enough documentation to support the existence of a comorbid condition (CC) or major comorbid condition (MCC), can have significant financial implications (see table).

2017 DRG medicare reimbursements for our hospital


MS Diagnosis-related group (DRG)
W/O CC
W/ CC
W/ MCC
SPINAL DISORDERS & INJURIES
 $8,024.21
 $14,790.38
 
NERVOUS SYSTEM NEOPLASMS
 $9,585.56
 
 $12,425.49
DEGENERATIVE NERVOUS SYSTEM DISORDERS
 $10,450.70
 
 $17,278.46
MULTIPLE SCLEROSIS & CEREBELLAR ATAXIA
 $7,600.51
 $9,803.01
 $15,731.11
ACUTE ISCHEMIC STROKE W USE OF THROMBOLYTIC AGENT
 $14,711.98
 $17,606.97
 $25,540.65
INTRACRANIAL HEMORRHAGE OR CEREBRAL INFARCTION
 $6,965.89
 $9,734.88 (OR TPA within 24hr pre-arrival)
 $16,348.93
NONSPECIFIC CVA & PRECEREBRAL OCCLUSION W/O INFARCT
 $8,080.21
 
 $12,481.48
TRANSIENT ISCHEMIA
 $6,880.96
 
 
NONSPECIFIC CEREBROVASCULAR DISORDERS
 $6,863.23
 $9,155.33
 $15,197.28
CRANIAL & PERIPHERAL NERVE DISORDERS
 $8,576.70
 
 $12,315.36
VIRAL MENINGITIS
 $8,955.61
 $15,837.50
 
HYPERTENSIVE ENCEPHALOPATHY
 $6,545.92
 $8,838.95
 $14,705.45
NONTRAUMATIC STUPOR & COMA
 $7,144.14
 
 $11,727.40
TRAUMATIC STUPOR & COMA, COMA >1 HR
 $8,643.90
 $11,961.65
 $18,739.02
TRAUMATIC STUPOR & COMA, COMA <1 HR
 $7,531.45
 $10,652.28
 $18,696.09
CONCUSSION
 $7,127.34
 $9,482.90
 $13,850.58
OTHER DISORDERS OF NERVOUS SYSTEM
 $6,592.58
 $8,586.97
 $14,711.98
BACTERIAL & TUBERCULOUS INFECTIONS OF NERVOUS SYSTEM
 $19,988.66
 $22,212.63
 $32,496.28
NON-BACTERIAL INFECT OF NERVOUS SYS EXC VIRAL MENINGITIS
 $11,913.12
 $16,929.42
 $28,967.60
SEIZURES
 $7,456.78
 
 $14,871.57
HEADACHES
 $6,910.82
 
 $9,939.27


Many times, however, the comorbid condition exists but the final billing fails to reflect their existence. I conducted a contextual inquiry to learn about documentation pitfalls that can affect providers and classified them into 6 types of errors:
  • Poor specificity
  • Omission (things with objective indicators elsewhere)
  • Omission (things subjective)
  • Technical or linguistic
  • Timing
  • Conflicting information

Errors of Poor Specificity

Vague problems are typically billed lower than specific ones, etiologies
Examples
  • heart failure is ambiguous -> instead, specify systolic/diastolic heart failure
  • respiratory failure or dyspnea is ambiguous -> instead specify respiratory failure secondary to community acquired pneumonia
  • Encephalopathy is ambiguous -> instead specify etiology
  • chest pain is ambiguous

Errors of omission

When imaging or labs are abnormal but the documentation does not address the diagnosis and plan. Hospital cannot bill on the basis of lab or imaging report or pathology report alone.
Examples
  • Cerebral edema - midline shift mentioned in imaging but not in assessment/plan
  • Brain compression 
  • Moderate/Severe protein/calorie malnutrition – this is a CC/MCC (Comorbid condition), always mentioned in the nutrition note, but hospital cannot bill based on a nutrition note is note enough
  • Morbid obesity – this is a CC/MCC
  • Anemia, thrombocytopenia, hypokalemia – abnormalities in CBC/BMP contribute to diagnoses and CC/MCC, but are often ignored by providers

Professional Billing

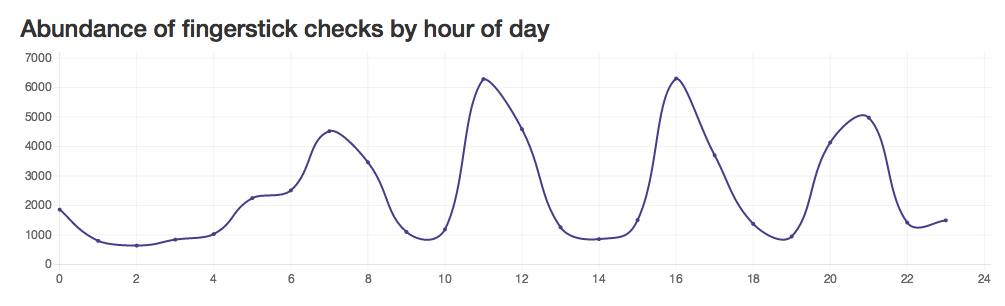
One type of professional billing is based on the complexity of medical decision making, and has a number of rules that can be difficult to remember. I ran analytics on these data to find deficits or outliers in billing.


Using these types of analyses, providers can see if they are outliers in choosing level of service. Further work will help providers see financial magnitude of these outliers.

Probably the biggest intervention has been to help providers quickly calculate billing level and see their gaps in documentation. I created a tool to help calculate the medical complexity, which providers can use on their phones before closing notes.

Update: 
People started asking for this calculator, so I decided to make it available on the Apple App Store. Enjoy! Get BillUp on the Apple App Store


2017-01-01

Harnessing Big Data to Count Calories in the ICU

This post on my nutrition project using the Board Rounds app appeared on the Penn Medicine blog 12/21/2016.


Harnessing Big Data to Count Calories in the ICU

do_medium
Feeling hungry is a signal from our bodies to our brains that we need fuel to be healthy. But some patients in the intensive care unit (ICU) with traumatic brain injuries or other complications are not able to express or even sense hunger. Often, these patients are connected to tubes that deliver enteral nutrition (EN), a liquid formulation of nutrients delivered to the GI tract.
EN has been shown to have a positive impact on the recovery process, from reducing infections to shortening the length of hospital stays to promoting faster cognitive recovery. But, EN is only beneficial if patients are receiving enough nutrients to counterbalance their energy expenditure – even immobile patients burn calories through normal biological functions like breathing and thinking. However, the average patient only receives about 50 percent of their daily calorie needs, meaning that many patients in the ICU are at risk for malnutrition.  That’s where David Do, MD, a software developer and Neurology resident at Penn, and his fellow researchers come in—they are working on software that will make it easier to track a patient’s nutritional needs and make sure they are getting enough daily calories to help them recover properly.
I sat down with Do to ask him a few questions about the software he is developing and how it will help patients.
Q: Why is nutrition so important for ICU patients?
A: Nutrition is actually a really important part of the recovery process for anyone who is sick. Think about it: even with the common cold, general treatment advice is to rest up and get plenty of food and fluids to help you heal. This is even more important for people who are critically ill and/or in the ICU. 
Patients who are underfed have a higher risk for muscular breakdown and have more trouble fighting off infections. Most of my patients in the Neurointensive Care Unit are in the hospital for a week or longer and in that time it's possible for serious nutrient deficiencies to occur that could ultimately impact the recovery process.
Q:  Why are some ICU patients under-nourished?
A: Normally, our bodies tell us when and how much we need to eat through our sense of hunger. But patients with brain injuries, swallowing malfunctions, or who are on ventilators, can’t tell us when they feel hungry. Instead, they have to rely on clinicians to deliver the right amount of nutrients through feeding tubes.
Q: What challenges to do care teams face when trying to ensure patients receive proper nourishment?
A: Critically ill patients have really complicated medical problems and care teams are often focused on these pressing issues. Unfortunately, sometimes this means that nutrition can fall to the bottom of the list of needs. To make things more complicated, each patient has different needs, meaning they need customized nutrition plans that often require complex calculations. Getting the nutrition levels correct can be challenging for clinicians who are balancing many complicated care needs for several patients. That’s why we created our Enteral Nutrition Calorimeter software—to make it easier for care providers to give patients the nutrients they need to support the recovery process.
nutrition_medium
Q: How does the software work?
A: This project is really about how we can leverage data that we already have through electronic medical records (EMR) to improve care. In the Calorimeter project, we designed custom monitoring software that tallies the patient’s intake and, based on the nutritional content of the feed, determines how many calories and grams of protein the patient has received. We then estimate each patient’s energy expenditure to determine who received enough. We use this data to provide constant feedback to clinicians by sending automated secure messages to the right person at the right time.
Q: What results have you seen so far?
A: Right now, we are going through the design phase. Our early investigations have helped us map out the obstacles to feeding. We even tried placing a clinician on daily rounds who was dedicated to optimizing nutrition, which improved feeding rates dramatically. While the extra attention may not be sustainable or scalable, we identified several barriers that are addressable through automated methods. We are working on crafting and testing messages to see what makes clinicians respond the most.  
Q: As a resident, how you were supported by Penn faculty to move this project forward?
A: The Neurology faculty have been tremendously supportive of this project, especially the Neurointensive Care faculty who were eager to help design and adopt our solution in their unit. Penn Medicine has become a great environment for interdisciplinary collaborations and innovations, especially for residents. Since I first arrived at Penn more than three and half years ago, I’ve seen a tremendous investment in infrastructure and technology that now allows us to rapidly build and test tech-enabled interventions and applications that will improve patient care. 
Do and his fellow researchers were recently awarded funding for their project through Penn’s Innovation Accelerator Program. Now in its fourth year, the Innovation Accelerator Program from the Penn Medicine Center for Health Care Innovation supports promising ideas from faculty and staff across departments and roles at the University of Pennsylvania Health System in their efforts to develop, test, and implement new approaches to care. This year’s program is co-sponsored by UnitedHealthcare.
The research team includes John Chandler, MD, Neurocritical Care Physician; Joshua Vanderwerf, MD, Neurology Resident; Jennifer McKenna, CNSS, Clinical Dietitian Specialist; Bethany Young, RN, Clinical Nurse Specialist; Susan Kennedy, CNSS, Clinical Dietitian Specialist; Kai Holder, Research Assistant; Davis Hermann, Design Strategist, and Diane Dao, Innovation Intern


The Evolution of Social Media

10:28 AM Posted by David, MD , No comments

Previously, I wrote about what an EMR built on Twitter would look like. Some readers interpreted this literally, citing concerns about security and other practical issues about storing patient data on Twitter. Social media has demonstrated a new level of awareness of events and information, and allowed conversations to take place involving participants from around the world. Meanwhile, there is a data problem in our hospitals. We are not sharing, utilizing, or predicting enough, even within the walls of a single building. Twitter is not an electronic medical record, but it has revolutionized the way we communicate information, serving as an important conceptual model for our future EMRs.

Several years ago, I awoke to my house shaking. I didn’t know what was going on, but seconds later the word earthquake was trending on Twitter, and you could see the exact geographic extent. I was amazed at how quickly this crowdsourced information emerged, ahead of all major news outlets; in fact, there are tools that news outlets use to mine Twitter for potential stories. In healthcare, how can we think of our conversations about patients in the same way, allowing for faster and more adequate responses to new data and clinical changes?

The maps below serve as a conceptual model for how social media has built on each type of electronic communication before it, and serves as a roadmap for how we can follow suit in healthcare. Each node represents a communication event and each line represents a participant in healthcare, a provider or a patient.


Map #1

In communication: This map represents letters, faxes, and emails--types of communication in which two or more participants are included in a thread and share messages back and forth.

In healthcare: Clinicians have been using this type of communication for quite some time. Hospitalists and specialists send messages, usually with primary care providers. Primary care doctors communicate results with patients in this manner. This will always be a necessary form of communication, but its usefulness depends on a primary care doctor to manage and coordinate all of a patient’s care.

Features

  • After the last message, the thread dies. The correspondence does not persist for other providers to see.
  • Good for private communications


Map #2

In communication: This map represents forums, chatrooms, or periodicals—types of communication in which a conversation persists beyond any single participant. Participants can come and go, and newcomers have the opportunity to see and understand what happened before.

In healthcare: EMRs, and to some extent the paper charts the proceeded them, have allowed data to persist independently of the participants of the conversation. As a new doctor to a patient in many cases you have access to a body of information and it will persist for the next provider. This can be very helpful for multidisciplinary care.

Features

  • New participants to the conversation have the opportunity to see and understand what happened before.
  • The “paper trail” makes it possible, although time consuming, to go back and process the history or to find important information


Map #3

In communication: This map represents blogs or RSS feeds—types of communication in which several content producers can broadcast news, while any reader can choose any number of feeds to subscribe to.

In healthcare: This type of communication is underdeveloped in healthcare, but is necessary to facilitate consolidation and contextual interpretation of data:

  • Consolidation - Currently, providers must manually collect and consolidate data from many sources. This occurs on the hospital level (talking to nurses, talking to the patient, getting information from EMR, testing schedules, and discussing cases with consultants) and on the EMR level (looking in “labs”, “imaging”, “flowsheets” sections).
  • Context - EMRs, to this point, have not been designed to facilitate interpretation of data. A piece of information is classically observed through an EMR’s interface, in a particular view. But the reality context is essential to accurate interpretation; the patient, the diagnosis, the perspective of the specialist. A sodium value, for example, means different things according to:
    • diagnosis: liver failure, heart failure, SIADH, DKA
    • patient: baseline sodium levels and acuity of the change
    • recent interventions: medications and fluids given

An “open data” architecture with feeds could allow development of custom interfaces that do more of this work.

Features

  • It gives users a chance to consume more, high yield information, increasing their awareness of news
  • Allows news to come to the user rather than vice versa
  • Allows for contextual interpretation of data


Map #4

In communication: This map represents Twitter and Facebook—types of communication where users can produce and consume posts. Users have access to feeds that allow a prioritized way to see important posts, and responses.

In healthcare: This type of communication is nonexistent in healthcare. I see this as a central piece to true patient-centered care, allowing patient involvement in conversations.

  • Enhance Conversations: Imagine if clinicians could have a conversation about a particular patient, a new data point, and patients participate. Information can be “retweeted” between providers to highlight data of importance. Each communication, in the prior models, becomes a conversation.
  • Enhance Coordination of Care: imagine if multiple consultants, therapists, could coordinate care better,
  • Satisfaction: This increased awareness not only would allow clinicians to take better care of patients, but patient awareness of the conversations, the schedules, could reduce the mystery of their care and increase satisfaction.

Features

  • Each node becomes a conversation
  • Content consumers are also content producers
  • Prioritization of nodes based on users


I imagine a time when a doctor subscribes to a patient’s “feed” and becomes aware of all the data and events. At my institution, we are designing and building a suite of tools that span these models of communication.


2016-07-14

ResultCast: A Tool For Reporting of Results

4:01 PM Posted by David, MD No comments


Introduction

For real-time reporting of long-term EEG results in our hospital, we have an extensive email listserv, through which brief reports are sent three times daily. Most email recipients have no patients on the list, and therefore users are forced to sort through the junk every day. 
In many cases the recipients of the messages are not the primary providers of the patients, and there are many degrees of separation between the patient, the providers, the interpreters of the data.

EEG machine <-> EEG technician <-> EEG fellow <-> Neurology consult team <-> Primary team <-> Patient

Such a system has limitations


  • Workflow burden - EEG interpreters have many hours of data to manually sift through to find important data
  • Delayed diagnosis (detection), and communication of conditions like subclinical status epilepticus 
  • Delayed feedback of adequacy of anticonvulsant therapy – there are many patients connected at a given time, routinely reported three times daily
  • Fragmented communication - Primary provider is often excluded from the primary conversation (when not a part of the listserv)
  • EEG interpreter is excluded from the clinical updates and the clinical context that helps with interpretation of data (medications given, changes in exam)
  • Email inbox clutter
  • Limited continuity – overnight usually by different MD and different EEG fellow (see next page)

Solution

I designed an EMR-integrated system for reporting and broadcasting the data. This system facilitates workflow of the EEG fellow and helps communicate to all relevant providers without cluttering inboxes.


Benefits

  • Earlier diagnosis
    • More clear triage of patients who need close EEG attention overnight
    • Offering Primary provider involvement in the conversation encourages them to contribute updated clinical status, to seek help at critical times, and to know what to look out for.
  • Reduced resource utilization
    • More clear indications that goals have been met and sooner discontinuation of EEG. Often a patient is connected to continuous EEG because of a poor mental status, and could be immediately disconnected once they show wakefulness. The primary team may be aware of wakefulness, but leaves the EEG on.
  • Streamlined communication
    • This system reduces cluttered email chains and allows EEG readers to leave more frequent updates on patients who need them without feeling like they are cluttering in boxes.
    • Handoffs – overnight person sees the conversation that occurred earlier in the day and vice versa


2016-04-12

Fingerstick glucose

2:40 PM Posted by David, MD No comments
This is the start of a series where I will generate charts of de-identified data analysis, revealing some things we knew and some we did not about physiology. The queries that I run do not return any protected health information.

Fingerstick glucose

Fingerstick glucose can be measured with a handheld device with instantaneous results. They are regarded as less accurate than the gold standard laboratory glucose. Here I plotted fingerstick glucose measurements against laboratory glucose measurements that were done within 15 minutes of each other. Except for a few outliers, the reliability appears good.


The abundance of fingerstick measurements by hour of day reveals, as expected, peaks, at 7am, 11am, 4pm, and 9pm, before breakfast, lunch, dinner, and bedtime.


The average glucose measurement by hour of day reveals a diurnal trend that is influenced by the meals we eat.

Hypoglycemic events (glucose measurement under 60) are most common at 3am, 9am, 2pm, 6pm, and 10pm. This corresponds to 1-2 hours after meals. Is this perhaps from people eating less than expected?

Hyperglycemic events (glucose measurement over 300) tend to happen at the same post-meal times.

When I stratify the population by age, we can see that people over 40 tend to remain at a higher glucose level, even between meals. Over time, their area under the curve is significantly higher. I chose not to adjust for other factors like comorbid illness and weight, because in real life those things co-occur. Therefore, this does not evaluate age as an independent risk factor.

When I stratify the population by weight, we can see that there is minimal difference between patients over and under 80kg. The only significant difference is overnight at 2-4am, when the heavier group has a much higher level.
The trend continues when we stratify with a cutoff of 120kg.

2016-04-06

Handbook Publisher

9:58 PM Posted by David, MD , No comments

Introduction

Medical providers often use quick-reference handbooks that are specific to their hospital or specialty. Handbook Publisher is an open source app that offers wiki-style editing and sharing of content. It is built with a front end framework for a lag-free experience.

I built this to publish content written along with several colleges about acute stroke management. This tool could be useful for institutional branding.

This project is open source
https://github.com/davehdo/handbook-publisher

Technologies

Rails 4
Angularjs
MongoDB

Screenshots


2016-01-09

Simple problem list

9:06 PM Posted by David, MD , , No comments

Introduction

Tools for physician workflow (e.g. "signout" and "handoff" applications) often neglect the fact that actionable items are tightly associated with plans and problems. Here I designed a Problem List app where problems are identified for billing and other purposes, and items with square brackets are interpreted as checklist items. Using a simple markdown language prevents users from having to update information in two places.

This project is open source: https://github.com/davehdo/simple-problem-list 

Features

  • a simple markdown language with two-way binding produces interactive checklists that automatically convert [] to [x] and vice versa
  • client side framework gives a seamless experience without pauses for loading

Future directions


  • version control and conflict management for multiple users
  • allow users to assign ICD codes to problems using autocomplete

Technologies

  • Backbone.js 
  • Twitter Bootstrap


Below is the user interface for entering the plan in free text. 

After saving, problems are considered separately and actionable items are pulled to the checklist on the side.

After plans are set for the day, actionable items can be seen and checked off from a list view.